18 Sep 2025
Characterizing the geometry of an object orbiting around a star from its transit light curve is a powerful tool to uncover various complex phenomena. This problem is inherently ill-posed, since similar or identical light curves can be produced by multiple different shapes. In this study, we investigate the extent to which the features of a shape can be embedded in a transit light curve. We generate a library of two-dimensional random shapes and simulate their transit light curves with light curve simulator, Yuti. Each shape is decomposed into a series of elliptical components expressed in the form of Fourier coefficients that adds increasingly diminishing perturbations to an ideal ellipse. We train deep neural networks to predict these Fourier coefficients directly from simulated light curves. Our results demonstrate that the neural network can successfully reconstruct the low-order ellipses, which describe overall shape, orientation and large-scale perturbations. For higher order ellipses the scale is successfully determined but the inference of eccentricity and orientation is limited, demonstrating the extent of shape information in the light curve. We explore the impact of non-convex shape features in reconstruction, and show its dependence on shape orientation. The level of reconstruction achieved by the neural network underscores the utility of using light curves as a means to extract geometric information from transiting systems.
03 Sep 2025
The MAG payload onboard India's first solar mission, Aditya-L1, is a dual-senssor fluxgate magnetometer designed to measure th interplanetary magnetic field (IMF) while operating in a halo orbit around the first Sun-Earth Lagrangian point (l1). Since becoming operational in January 2024, MAG has continuously recorded local magnetic field data and has captured several solar transient events over the past one year. During these events, the IMF, typically around 5 nT, exhibited significant enhancements in magnitude. This study focuses on three such solar events observed in March, May, and October 2024. Analysis of the magnetic field power spectra during these events reveals fluctuations consistent with Kolmogorov type turbulence, characterized by a spectral slope close to -5/3. To emphasize changes in spectral behavior, the event-day spectra are compared with those from a day when the quiet solar wind conditions prevail. A marked contrast is observed: while the quiet periods exhibit anisotropic turbulence, the extreme events display quasi-isotropic behavior, with spectral slopes closely following the Kolmogorov spectrum across all three IMF components. The results, including detailed variations in spectral slope and turbulence characteristics, are presented and discussed in this paper.
10 Oct 2025
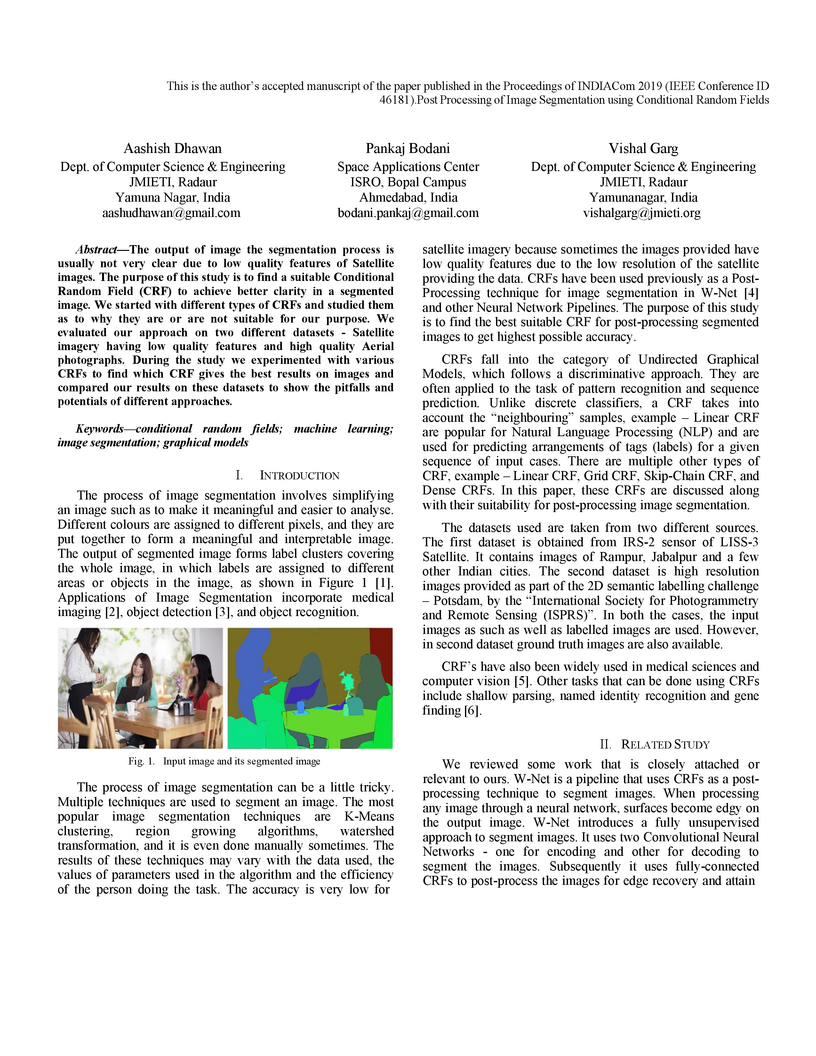
The output of image the segmentation process is usually not very clear due to low quality features of Satellite images. The purpose of this study is to find a suitable Conditional Random Field (CRF) to achieve better clarity in a segmented image. We started with different types of CRFs and studied them as to why they are or are not suitable for our purpose. We evaluated our approach on two different datasets - Satellite imagery having low quality features and high quality Aerial photographs. During the study we experimented with various CRFs to find which CRF gives the best results on images and compared our results on these datasets to show the pitfalls and potentials of different approaches.
28 Jun 2024
Aditya-L1 is the first Indian solar mission placed at the first Lagrangian (L1) point to study the Sun. A fluxgate magnetometer (MAG) is one of the seven payloads and one of the three in-situ payloads onboard to measure the interplanetary magnetic field (IMF) coming from the Sun towards the Earth. At present, the Aditya-L1 spacecraft is in a halo-orbit around the L1 point and the MAG payload is ON is continuously measuring the IMF. This paper presents the first measurements of the IMF by MAG.
21 Aug 2025
Global lunar chemical maps are essential for understanding the origin and evolution of the Moon, its surface characteristics, and its potential for resource extraction. Lunar elemental abundance maps have been derived using X-ray and gamma ray spectroscopy previously but are limited in coverage or have coarse spatial resolution. Here we used X-ray fluorescence line intensity of O, Mg, Al, Si, Ca and Fe derived from five years of data from the Chandrayaan-2 Large Area Soft X-ray Spectrometer (CLASS) to generate global O/Si, Mg/Si, Al/Si, Mg/Al, Ca/Si and Fe/Si line intensity ratio maps at a resolution of 5.3 km/pixel. We have developed an independent data analysis methodology for CLASS, based on open source Python packages. Our analysis shows that the Mg/Al map best represents the geochemical differences between the major terranes, consistent with the findings of the Apollo 15 and 16 X-ray Fluorescence Spectrometer (XRS) maps. We have also shown a good correlation of the line intensity ratios with the abundance ratios from CLASS using published elemental abundance maps. Further, we apply Gaussian mixture models to the Mg/Si vs Al/Si density maps to map geochemically distinct regions on the Moon that could be of interest for future investigations.
03 Jul 2024
This paper uses a reactive flow large eddy simulation (LES) and decomposition techniques to study combustion instabilities in a methane-oxygen combustor. This work examines two case scenarios to elucidate the significance of injector-chamber frequency coupling as the cause of thermo-acoustic instability. Initial investigation in a well-known benchmark case of the continuously variable resonance combustor (CVRC) reports the potential instability mechanisms and the role of injector-chamber frequency coupling in thermo-acoustic instability. Subsequently, the multi-element rocket combustor case study identifies the critical resonant modes and highlights potential frequency coupling between the injector and the chamber region. The interplay between longitudinal pressure oscillations in the oxidizer post and transverse pressure waves in the chamber is responsible for the enhanced pressure dynamics in the combustor. The present work uses the dynamic mode decomposition (DMD) technique to reveal the evolution of acoustic modes in injector and chamber for CVRC and multi-element combustor. The dominant pressure mode forms found by DMD analysis also showcase the role of injector-chamber frequency coupling in amplified combustion dynamics. The results demonstrate how the predominant cause of combustion instability in rocket combustors can be effectively determined using the high-fidelity LES framework in conjunction with the modal decomposition technique.

30 Sep 2025
Solar Low Energy X-ray Spectrometer on board Aditya-L1: Ground Calibration and In-flight Performance
Solar Low Energy X-ray Spectrometer on board Aditya-L1: Ground Calibration and In-flight Performance
The Solar Low-Energy X-ray Spectrometer (SoLEXS) on board India's Aditya-L1 mission was launched on 2 September 2023 and commenced solar observations on 13 December 2023 following successful aperture cover deployment. Operating from the Sun-Earth L1 Lagrange point, SoLEXS has been providing continuous Sun-as-a-star soft X-ray spectroscopy across 2-22 keV with 170 eV resolution at 5.9 keV and 1-second temporal cadence since 6 January 2024. The instrument employs two Silicon Drift Detectors with aperture areas of 7.1 mm and 0.1 mm to accommodate the full dynamic range of solar activity from A-class to X-class flares. This paper presents comprehensive ground and on board calibration procedures that establish SoLEXS's quantitative spectroscopic capabilities. Ground calibration encompassed energy-channel relationships, spectral resolution characterization, instrument response functions, and collimator angular response measurements, with thermo-vacuum testing validating performance stability across operational temperature ranges. On board calibration utilizing an internal Fe source demonstrated preserved post-launch spectral resolution (164.9-171.2 eV), while cross-calibration with GOES-XRS and Chandrayaan-2/XSM confirmed radiometric accuracy and flux agreement. The instrument's 100% observational duty cycle at L1 enables unprecedented continuous monitoring of solar flare evolution across all intensity classes, providing calibrated data for advancing coronal heating mechanisms, flare energetics, and flare-coronal mass ejection relationship studies through soft X-ray spectroscopy.
25 Jan 2024
With the sustained rise in satellite deployment in Low Earth Orbits, the collision risk from untracked space debris is also increasing. Often small-sized space debris (below 10 cm) are hard to track using the existing state-of-the-art methods. However, knowing such space debris' trajectory is crucial to avoid future collisions. We present a Physics Informed Neural Network (PINN) - based approach for estimation of the trajectory of space debris after a collision event between active satellite and space debris. In this work, we have simulated 8565 inelastic collision events between active satellites and space debris. Using the velocities of the colliding objects before the collision, we calculate the post-collision velocities and record the observations. The state (position and velocity), coefficient of restitution, and mass estimation of un-tracked space debris after an inelastic collision event along with the tracked active satellite can be posed as an optimization problem by observing the deviation of the active satellite from the trajectory. We have applied the classical optimization method, the Lagrange multiplier approach, for solving the above optimization problem and observed that its state estimation is not satisfactory as the system is under-determined. Subsequently, we have designed Deep Neural network-based methods and Physics Informed Neural Network (PINN )based methods for solving the above optimization problem. We have compared the performance of the models using root mean square error (RMSE) and interquartile range of the predictions. It has been observed that the PINN-based methods provide a better prediction for position, velocity, mass and coefficient of restitution of the space debris compared to other methods.
12 Aug 2025
The Solar Ultraviolet Imaging Telescope (SUIT) is an instrument onboard Aditya--L1, the first solar space observatory of the Indian Space Research Organization (ISRO), India, launched on September 2, 2023. SUIT is designed to image the Sun in the 200--400 nm wavelength band in eight narrowband and three broadband filters. SUIT's science goals start with observing the solar atmosphere and large-scale continuum variations, the physics of solar flares in the NUV region, and many more. The paper elucidates the functioning of the instrument, software packages developed for easier calibration, analysis, and feedback, calibration routines, and the regular maintenance activity of SUIT during the first year of its operation. The paper also presents the various operations undergone by, numerous program sequences orchestrated to achieve the science requirements, and highlights some remarkable observations made during the first year of observations with SUIT.
26 Sep 2024
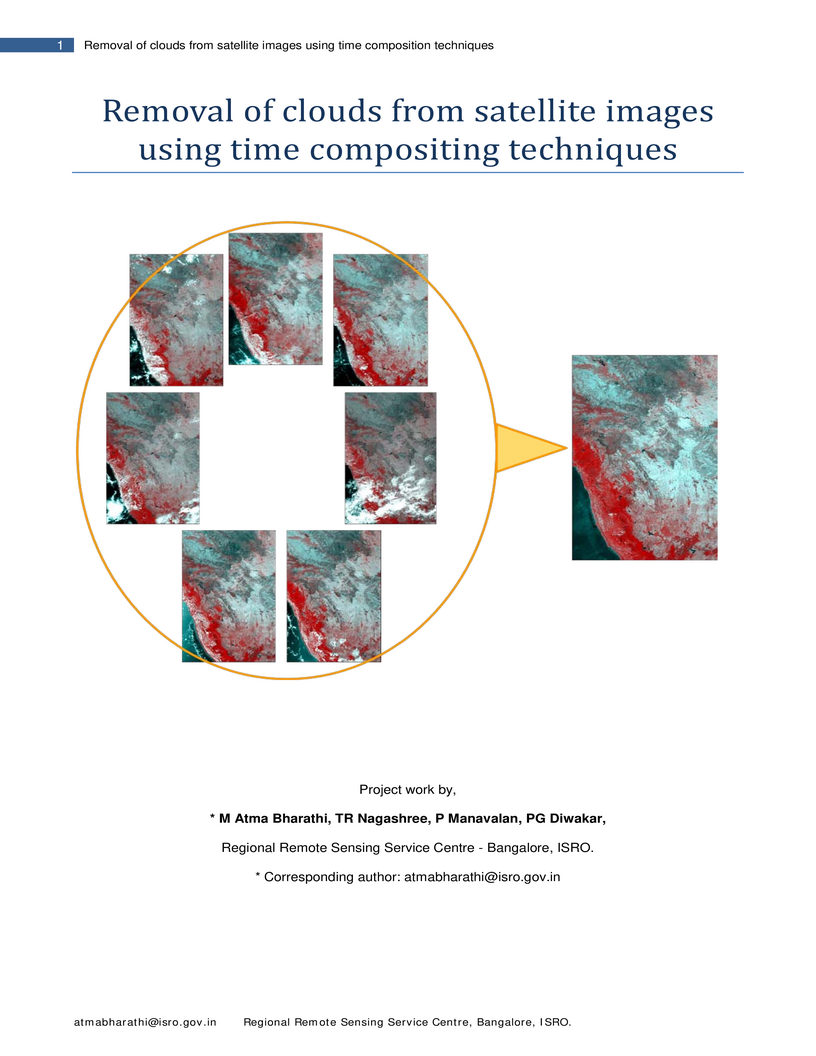
Clouds in satellite images are a deterrent to qualitative and quantitative study. Time compositing methods compare a series of co-registered images and retrieve only those pixels that have comparatively lesser cloud cover for the resultant image. Two different approaches of time compositing were tested. The first method recoded the clouds to value 0 on all the constituent images and ran a 'max' function. The second method directly ran a 'min' function without recoding on all the images for the resultant image. The 'max' function gave a highly mottled image while the 'min' function gave a superior quality image with smoother texture. Persistent clouds on all constituent images were retained in both methods, but they were readily identifiable and easily extractable in the 'max' function image as they were recoded to 0, while that in the 'min' function appeared with varying DN values. Hence a hybrid technique was created which recodes the clouds to value 255 and runs a 'min' function. This method preserved the quality of the 'min' function and the advantage of retrieving clouds as in the 'max' function image. The models were created using Erdas Imagine Modeler 9.1 and MODIS 250 m resolution images of coastal Karnataka in the months of May, June 2008 were used. A detailed investigation on the different methods is described and scope for automating different techniques is discussed.
27 Jan 2024
 CNRS
CNRS Tohoku University
 University of Amsterdam
 California Institute of Technology
 University of Illinois at Urbana-ChampaignNikhefTata Institute of Fundamental Research
 University of Minnesota
 University of Maryland
 University of TokyoIndian Institute of ScienceAshoka University
 Stockholm UniversityChennai Mathematical InstitutePhysical Research LaboratoryInter-University Center for Astronomy and AstrophysicsUniversité Côte d’AzurWashington State UniversityIndian Institute of AstrophysicsRaman Research InstituteU R Rao Satellite CentreThe Open University of IsraelIISER ThiruvananthapuramThe University of Texas at ArlingtonIndian Center for Space PhysicsVikram Sarabhai Space CentreISRO/Vikram Sarabhai Space CentreIIT, Bombay
We present the science case for the proposed Daksha high energy transients
mission. Daksha will comprise of two satellites covering the entire sky from
1~keV to ~MeV. The primary objectives of the mission are to discover and
characterize electromagnetic counterparts to gravitational wave source; and to
study Gamma Ray Bursts (GRBs). Daksha is a versatile all-sky monitor that can
address a wide variety of science cases. With its broadband spectral response,
high sensitivity, and continuous all-sky coverage, it will discover fainter and
rarer sources than any other existing or proposed mission. Daksha can make key
strides in GRB research with polarization studies, prompt soft spectroscopy,
and fine time-resolved spectral studies. Daksha will provide continuous
monitoring of X-ray pulsars. It will detect magnetar outbursts and high energy
counterparts to Fast Radio Bursts. Using Earth occultation to measure source
fluxes, the two satellites together will obtain daily flux measurements of
bright hard X-ray sources including active galactic nuclei, X-ray binaries, and
slow transients like Novae. Correlation studies between the two satellites can
be used to probe primordial black holes through lensing. Daksha will have a set
of detectors continuously pointing towards the Sun, providing excellent hard
X-ray monitoring data. Closer to home, the high sensitivity and time resolution
of Daksha can be leveraged for the characterization of Terrestrial Gamma-ray
Flashes.
16 Dec 2024
Science Filter Characterization of the Solar Ultraviolet Imaging Telescope (SUIT) on board Aditya-L1
Science Filter Characterization of the Solar Ultraviolet Imaging Telescope (SUIT) on board Aditya-L1
The Solar Ultraviolet Imaging Telescope (SUIT) on board the Aditya-L1 mission is designed to observe the Sun across 200-400 nm wavelength. The telescope used 16 dichroic filters tuned at specific wavelengths in various combinations to achieve its science goals. For accurate measurements and interpretation, it is important to characterize these filters for spectral variations as a function of spatial location and tilt angle. Moreover, we also measured out-of-band and in-band transmission characteristics with respect to the inband transmissions. In this paper, we present the experimental setup, test methodology, and the analyzed results. Our findings reveal that the transmission properties of all filters meet the expected performance for spatial variation of transmission and the transmission band at a specific tilt angle. The out-of-band transmission for all filters is below 1% with respect to in-band, except for filters BB01 and NB01. These results confirm the capabilities of SUIT to effectively capture critical solar features in the anticipated layer of the solar atmosphere.
15 May 2025
Physical properties of galaxies are correlated with their local environment.
Quantifying these environmental correlations is crucial for a better
understanding of galaxy formation and evolution. In this work, we investigate
how galaxy properties are correlated with the environment through spatial
clustering measurements of galaxies. Using two-point correlation functions and
marked correlation functions, we measure and compare the environmental
dependence of colour, stellar mass, luminosities in the , , , , and
bands, star formation rate, and specific star formation rate. We use galaxy
samples from the southern (G02 and G23) regions of the Galaxy and Mass Assembly
(GAMA) survey. Furthermore, we explore how redshift completeness affects
clustering measurements by comparing different subsets of the G02 region with
varying redshift completeness. We show that the and colours
correlate the most with the local environment, with stellar mass being the next
most reliable indicator of the environment. We also demonstrate that redshift
completeness has a significant effect on clustering measurements.
10 Jul 2025
SHAPE (Spectro-polarimetry of HAbitable Planet Earth) is an experiment onboard the Chandrayaan-3 Mission, designed to study the spectro-polarimetric signatures of the habitable planet Earth in the near-infrared (NIR) wavelength range (1.0 - 1.7 m). The spectro-polarimeter is the only scientific payload (experimental in nature) on the Propulsion Module (PM) of the Chandrayaan-3 mission. The instrument is a compact and lightweight spectro-polarimeter with an Acousto-Optic Tunable Filter (AOTF) at its core. The AOTF operates in the frequency range of 80 MHz to 135 MHz with a power of 0.5 - 2.0 Watts. The two output beams (e-beam and o-beam) from the AOTF are focused onto two InGaAs detectors (pixelated, 1D linear array) with the help of focusing optics. The primary (aperture) optics, with a diameter of 2 mm, collects the NIR light for input to the AOTF, defining the field of view (FOV) of 2.6. The payload has a mass of 4.8 kg and operates at a power of 25 Watts. This manuscript highlights some of the ground-based results, including the post-launch initial performance of the payload while orbiting around the Moon to observe Earth.
04 Feb 2020

Results of the initial calibration of the Ultra-Violet Imaging Telescope
(UVIT) were reported earlier by Tandon et al. (2017). The results reported
earlier were based on the ground calibration as well as the first observations
in orbit. Some additional data from the ground calibration and data from more
in-orbit observations have been used to improve the results. In particular,
extensive new data from in-orbit observations have been used to obtain (a) new
photometric calibration which includes (i) zero-points (ii) flat fields (iii)
saturation, (b) sensitivity variations (c) spectral calibration for the near
Ultra Violet (NUV; 2000 - 3000 Angstroms) and far Ultra-Violet (FUV; 1300 -
1800 Angstroms) gratings, (d) point spread function and (e) astrometric
calibration which included distortion. Data acquired over the last three years
show continued good performance of UVIT with no reduction in sensitivity in
both the UV channels.
18 Nov 2024
We present the spectral and timing study of the bright NS-LMXB GX 5-1 using \textit{\textit{AstroSat}/LAXPC} and \textit{SXT} observations conducted in the year 2018. During the observation, the source traces out the complete HB and NB of the Z-track in the HID. Understanding the spectral and temporal evolution of the source along the 'Z' track can probe the accretion process in the vicinity of a neutron star. Spectral analysis was performed in the 0.7-20 keV energy range for different segments in the HID using a multi-temperature disc black body with an average temperature, 0.46 and a thermal Comptonization model. It is found that the optical depth of the corona drops from 6.68 in HB to 2.74 in NB. The Timing analysis using the LAXPC instrument indicates the presence of quasi-periodic oscillations in HB, NB, and the hard apex of the Z-track. The observed QPO frequencies are similar to the characteristic frequencies of horizontal branch and normal branch oscillations. The HBO frequency increase from 12-46 Hz towards the hard apex. The timing studies conducted in soft and hard band indicate the association of HBO and NBO origin with the non-thermal component. Further research could explore the implications of this relationship for understanding the dynamics of accretion onto neutron stars.
03 Oct 2023
We present a comprehensive spectro-polarimetric study of persistent Black hole X-ray binary 4U with {\it IXPE} and {\it NICER} observations. The source is observed in disk dominated thermal state with disk temperature, kT keV. The emission during thermal state from the source is found to be moderately polarized and \textit{IXPE} measures a degree of polarization (PD) () along with a polarization angle (PA) in the energy range of keV. PD is found to be an increasing function of energy, whereas PA indicates switching within the energy range which could be due to high inclination and the returning radiation within the system. Simultaneous energy spectra ( keV) from {\it NICER} are modelled to study the spectral properties. Furthermore, the spin parameter of the black hole is estimated with spectro-polarimetric data as a, which is corroborated by {\it NICER} observations. Finally, we discuss the implications of our findings.
09 Aug 2024
We conducted a study on the X-ray polarization properties of MCG-5-23-16 by analyzing long-term monitoring data from {\it NuSTAR} jointly with {\it IXPE} observations made in May and November 2022. The re-analysis of {\it IXPE} data gives model-dependent polarization degree, PD (\%) = in the energy band keV. The model-independent analysis of PD poses an upper limit of ( level) for the same energy band. The observed upper limit of PD, along with broadband spectral analysis ( keV) using an accretion-ejection based model, allowed us to derive the corona geometry (i.e. radius and height) and the accretion disk inclination (). Additional {\it NuSTAR} observations were also analyzed to gain insights into the accretion flow properties of the source and to estimate the expected polarization during those epochs with PD . The radius and height of the corona varies between r and r respectively, with a mass outflow rate from the corona measuring Eddington rate (). The spectral analysis further provided an estimate for the mass of the central black hole M and the velocity of the outflowing gas . A comparative broadband spectral study using reflection-based models estimates the disk inclination between , and yields an expected PD of 3.4-6.0\%. The expected PD measured using accretion-ejection and reflection models is less compared to the expected PD measured for a given disk inclination of . Our modeling of the disk-corona-outflows and polarization connection can be extended and validated with data from the recently launched \textit{XPoSat}, India's first X-ray Polarimeter Satellite, offering potential applications to other sources.
02 Aug 2021
We present a detailed spectral and timing analysis of Cygnus X-1 with multi-epoch observations, during to , by SXT and LAXPC on-board AstroSat. We model the spectra in broad energy range of to study the evolution of spectral properties while Cygnus X-1 transited from hard state to an extreme soft state via intermediate states in 2017. Simultaneous timing features are also examined by modelling the power density spectra in . We find that during high-soft state observations, made by AstroSat on Oct (MJD ), the energy spectrum of the source exhibits an inner disk temperature (kT) of , a very steep photon index () of along with a fractional disk flux contribution of . The power density spectrum in the range of is also very steep with a power-law index of along with a high RMS value of . Comparing the spectral softness of high-soft state with those of previously reported, we confirm that {\it AstroSat} observed Cygnus X-1 in the `softest' state. The lowest MAXI spectral hardness ratio of corroborates the softest nature of the source. Moreover, we estimate the spin of the black hole by continuum-fitting method, which indicates that Cygnus X-1 is a maximally rotating `hole'. Further, Monte Carlo (MC) simulations are performed to estimate the uncertainty in spin parameter, which is constrained as a with confidence interval. Finally, we discuss the implications of our findings.
12 Aug 2025
We present a comprehensive spectro-temporal analysis of GRS observed with AstroSat during June, . A detailed study of the temporal properties reveals the appearance of an `unknown' variability class () during class transition of the source. This new `unknown' class () is characterized by the irregular repetition of low count `dips' along with the adjacent `flare' like features in between two successive steady count rate durations, resulting in uniform `' shaped distribution in the color-color diagram. A detailed comparative study of the variability properties between the class and other known variability classes of GRS indicates it as a distinct variability class of the source. Further, we find evidence of the presence of possible HFQPO features at Hz with quality factor , rms amplitude , and significance , respectively. In addition, a harmonic-like feature at Hz is also seen with quality factor , rms amplitude and significance . The energy-dependent power spectral study reveals that the fundamental HFQPO and its harmonic are present in keV and keV energy ranges, respectively. Moreover, the wide-band ( keV) spectral modelling comprising of thermal Comptonization component indicates the presence of a cool ( keV) and optically thick (optical depth ) Comptonizing `corona', which seems to be responsible in regulating the HFQPO features in GRS +. Finally, we find the bolometric luminosity () to be about within keV, indicating the sub-Eddington accretion regime of the source.
There are no more papers matching your filters at the moment.
