09 Apr 2025
Researchers at Massachusetts General Hospital and collaborating institutions develop a region-adaptive MRI super-resolution system combining mixture-of-experts with diffusion models, achieving superior image quality metrics while enabling specialized processing of distinct anatomical regions through three expert networks that dynamically adapt to tissue characteristics.
03 Mar 2025
While numerous architectures for medical image segmentation have been
proposed, achieving competitive performance with state-of-the-art models
networks such as nnUNet, still leave room for further innovation. In this work,
we introduce nnUZoo, an open source benchmarking framework built upon nnUNet,
which incorporates various deep learning architectures, including CNNs,
Transformers, and Mamba-based models. Using this framework, we provide a fair
comparison to demystify performance claims across different medical image
segmentation tasks. Additionally, in an effort to enrich the benchmarking, we
explored five new architectures based on Mamba and Transformers, collectively
named X2Net, and integrated them into nnUZoo for further evaluation. The
proposed models combine the features of conventional U2Net, nnUNet, CNN,
Transformer, and Mamba layers and architectures, called X2Net (UNETR2Net
(UNETR), SwT2Net (SwinTransformer), SS2D2Net (SwinUMamba), Alt1DM2Net
(LightUMamba), and MambaND2Net (MambaND)). We extensively evaluate the
performance of different models on six diverse medical image segmentation
datasets, including microscopy, ultrasound, CT, MRI, and PET, covering various
body parts, organs, and labels. We compare their performance, in terms of dice
score and computational efficiency, against their baseline models, U2Net, and
nnUNet. CNN models like nnUNet and U2Net demonstrated both speed and accuracy,
making them effective choices for medical image segmentation tasks.
Transformer-based models, while promising for certain imaging modalities,
exhibited high computational costs. Proposed Mamba-based X2Net architecture
(SS2D2Net) achieved competitive accuracy with no significantly difference from
nnUNet and U2Net, while using fewer parameters. However, they required
significantly longer training time, highlighting a trade-off between model
efficiency and computational cost.
16 Sep 2025
We present a probabilistic framework for modeling structured spatiotemporal dynamics from sparse observations, focusing on cardiac motion. Our approach integrates neural ordinary differential equations (NODEs), graph neural networks (GNNs), and neural processes into a unified model that captures uncertainty, temporal continuity, and anatomical structure. We represent dynamic systems as spatiotemporal multiplex graphs and model their latent trajectories using a GNN-parameterized vector field. Given the sparse context observations at node and edge levels, the model infers a distribution over latent initial states and control variables, enabling both interpolation and extrapolation of trajectories. We validate the method on three synthetic dynamical systems (coupled pendulum, Lorenz attractor, and Kuramoto oscillators) and two real-world cardiac imaging datasets - ACDC (N=150) and UK Biobank (N=526) - demonstrating accurate reconstruction, extrapolation, and disease classification capabilities. The model accurately reconstructs trajectories and extrapolates future cardiac cycles from a single observed cycle. It achieves state-of-the-art results on the ACDC classification task (up to 99% accuracy), and detects atrial fibrillation in UK Biobank subjects with competitive performance (up to 67% accuracy). This work introduces a flexible approach for analyzing cardiac motion and offers a foundation for graph-based learning in structured biomedical spatiotemporal time-series data.
03 Dec 2020
 ETH Zurich
 CNRS
CNRS University of Cambridge
 Tel Aviv University
 University College LondonUniversity of EdinburghUniversidade de LisboaTechnische Universität Dresden
 KU LeuvenRadboud UniversityUniversität HeidelbergUniversity of HelsinkiUppsala University
 University of Arizona
 Sorbonne Université
 Leiden UniversityUniversity of GenevaUniversity of ViennaUniversitat de BarcelonaUniversity of LeicesterObservatoire de ParisUniversité de LiègeINAF - Osservatorio Astrofisico di TorinoUniversité Côte d’Azur
 University of GroningenClemson UniversityLund UniversityUniversidad Nacional Autónoma de MéxicoSwinburne University of TechnologyUniversität HamburgThales Alenia Space
 European Southern ObservatoryLaboratoire d’Astrophysique de BordeauxSISSACNESUniversity of CalgaryUniversidad de La LagunaIMT AtlantiqueObservatoire de la Côte d’AzurEuropean Space Astronomy Centre (ESAC)Kapteyn Astronomical InstituteObservatoire astronomique de StrasbourgNational Observatory of AthensQueen's University BelfastUniversidade de Santiago de CompostelaINAF – Osservatorio Astronomico di RomaInstituto de Astrofísica de Canarias (IAC)Universidade da CoruñaINAF – Osservatorio Astronomico d’AbruzzoSRON Netherlands Institute for Space ResearchINAF - Osservatorio Astrofisico di CataniaUniversidade de VigoRoyal Observatory of BelgiumINAF- Osservatorio Astronomico di CagliariLeibniz-Institut für Astrophysik Potsdam (AIP)F.R.S.-FNRSTelespazio FRANCEAirbus Defence and SpaceInstituto Galego de Física de Altas Enerxías (IGFAE)Universitat Politècnica de Catalunya-BarcelonaTechSTAR InstituteEuropean Space Agency (ESA)Lund ObservatoryGeneva University HospitalLeiden ObservatoryFinnish Geospatial Research Institute FGICGIAgenzia Spaziale Italiana (ASI)Mullard Space Science LaboratoryInstitut de Ciències del Cosmos (ICCUB)Aurora TechnologyCentro de Supercomputación de Galicia (CESGA)Institut UTINAMGEPISERCOInstitut d’Astronomie et d’AstrophysiqueGMV Innovating Solutions S.L.Space Science Data Center (SSDC)Wallonia Space Centre (CSW)Indra Sistemas S.A.Universit PSL* National and Kapodistrian University of AthensUniversit
de ToulouseUniversit
Bourgogne Franche-ComtUniversit
Libre de BruxellesIstituto Nazionale di Fisica Nucleare INFNMax Planck Institut fr AstronomieUniversit
de LorraineUniversit
de BordeauxUniversit
de StrasbourgUniversit
di PadovaINAF
Osservatorio Astrofisico di ArcetriINAF
Osservatorio Astronomico di PadovaAstronomisches Rechen–InstitutINAF Osservatorio di Astrofisica e Scienza dello Spazio di Bologna
European Southern ObservatoryLaboratoire d’Astrophysique de BordeauxSISSACNESUniversity of CalgaryUniversidad de La LagunaIMT AtlantiqueObservatoire de la Côte d’AzurEuropean Space Astronomy Centre (ESAC)Kapteyn Astronomical InstituteObservatoire astronomique de StrasbourgNational Observatory of AthensQueen's University BelfastUniversidade de Santiago de CompostelaINAF – Osservatorio Astronomico di RomaInstituto de Astrofísica de Canarias (IAC)Universidade da CoruñaINAF – Osservatorio Astronomico d’AbruzzoSRON Netherlands Institute for Space ResearchINAF - Osservatorio Astrofisico di CataniaUniversidade de VigoRoyal Observatory of BelgiumINAF- Osservatorio Astronomico di CagliariLeibniz-Institut für Astrophysik Potsdam (AIP)F.R.S.-FNRSTelespazio FRANCEAirbus Defence and SpaceInstituto Galego de Física de Altas Enerxías (IGFAE)Universitat Politècnica de Catalunya-BarcelonaTechSTAR InstituteEuropean Space Agency (ESA)Lund ObservatoryGeneva University HospitalLeiden ObservatoryFinnish Geospatial Research Institute FGICGIAgenzia Spaziale Italiana (ASI)Mullard Space Science LaboratoryInstitut de Ciències del Cosmos (ICCUB)Aurora TechnologyCentro de Supercomputación de Galicia (CESGA)Institut UTINAMGEPISERCOInstitut d’Astronomie et d’AstrophysiqueGMV Innovating Solutions S.L.Space Science Data Center (SSDC)Wallonia Space Centre (CSW)Indra Sistemas S.A.Universit PSL* National and Kapodistrian University of AthensUniversit
de ToulouseUniversit
Bourgogne Franche-ComtUniversit
Libre de BruxellesIstituto Nazionale di Fisica Nucleare INFNMax Planck Institut fr AstronomieUniversit
de LorraineUniversit
de BordeauxUniversit
de StrasbourgUniversit
di PadovaINAF
Osservatorio Astrofisico di ArcetriINAF
Osservatorio Astronomico di PadovaAstronomisches Rechen–InstitutINAF Osservatorio di Astrofisica e Scienza dello Spazio di BolognaWe produce a clean and well-characterised catalogue of objects within 100\,pc
of the Sun from the \G\ Early Data Release 3. We characterise the catalogue
through comparisons to the full data release, external catalogues, and
simulations. We carry out a first analysis of the science that is possible with
this sample to demonstrate its potential and best practices for its use.
The selection of objects within 100\,pc from the full catalogue used selected
training sets, machine-learning procedures, astrometric quantities, and
solution quality indicators to determine a probability that the astrometric
solution is reliable. The training set construction exploited the astrometric
data, quality flags, and external photometry. For all candidates we calculated
distance posterior probability densities using Bayesian procedures and mock
catalogues to define priors. Any object with reliable astrometry and a non-zero
probability of being within 100\,pc is included in the catalogue.
We have produced a catalogue of \NFINAL\ objects that we estimate contains at
least 92\% of stars of stellar type M9 within 100\,pc of the Sun. We estimate
that 9\% of the stars in this catalogue probably lie outside 100\,pc, but when
the distance probability function is used, a correct treatment of this
contamination is possible. We produced luminosity functions with a high
signal-to-noise ratio for the main-sequence stars, giants, and white dwarfs. We
examined in detail the Hyades cluster, the white dwarf population, and
wide-binary systems and produced candidate lists for all three samples. We
detected local manifestations of several streams, superclusters, and halo
objects, in which we identified 12 members of \G\ Enceladus. We present the
first direct parallaxes of five objects in multiple systems within 10\,pc of
the Sun.
11 Nov 2025
 University of Southern CaliforniaShahid Beheshti UniversityShahid Beheshti University of Medical SciencesGeneva University HospitalNational Research Institute of Tuberculosis and Lung DiseasesTaleghani HospitalMasih Daneshvari HospitalRadiomics.bioShohada-ye Tajrish HospitalChronic Respiratory Diseases Research Center
This pilot study compares per-lesion radiomics features of [68Ga]-DOTA FAPI-46 and [18F]-FDG PET/CT in non-small cell lung cancer (NSCLC) to explore complementary insights into intratumoral heterogeneity beyond conventional SUV metrics, aiming to enhance lesion characterization and clinical decision-making. A total of 28 PET/CT scans (14 [18F]-FDG and 14 [68Ga]-DOTA FAPI-46) were acquired for the initial staging of biopsy-confirmed NSCLC. A total of 81 co-localized lesions (lung: 21, mediastinal lymph nodes: 42, bone: 18) were segmented, with radiomics features extracted via PyRadiomics after IBSI-compliant preprocessing. Paired per-lesion comparisons used t-tests or Wilcoxon signed-rank tests with Benjamini-Hochberg FDR correction. Significant differences (adjusted P < 0.05) were identified across intensity, texture, and shape features. In lung lesions, FAPI showed lower first-order metrics but higher variance and GLCM contrast, suggesting stromal heterogeneity. Mediastinal lymph nodes had fewer differences, with FAPI exhibiting lower run percentage (GLRLM: -0.298, -6.196, P=1.45E-08). Bone lesions showed extensive variations, including reduced FAPI entropy (e.g., Entropy: -1.743, -5.798, P=6.95E-08). Feature overlaps highlighted complementary stromal (FAPI) and metabolic (FDG) insights. This pilot study demonstrates that per-lesion radiomics can capture complementary biological information from FAPI and FDG PET in NSCLC, highlighting intratumoral heterogeneity and stromal activity not fully appreciated by conventional SUV-based metrics.
25 Apr 2024
This paper presents FlowCyt, the first comprehensive benchmark for multi-class single-cell classification in flow cytometry data. The dataset comprises bone marrow samples from 30 patients, with each cell characterized by twelve markers. Ground truth labels identify five hematological cell types: T lymphocytes, B lymphocytes, Monocytes, Mast cells, and Hematopoietic Stem/Progenitor Cells (HSPCs). Experiments utilize supervised inductive learning and semi-supervised transductive learning on up to 1 million cells per patient. Baseline methods include Gaussian Mixture Models, XGBoost, Random Forests, Deep Neural Networks, and Graph Neural Networks (GNNs). GNNs demonstrate superior performance by exploiting spatial relationships in graph-encoded data. The benchmark allows standardized evaluation of clinically relevant classification tasks, along with exploratory analyses to gain insights into hematological cell phenotypes. This represents the first public flow cytometry benchmark with a richly annotated, heterogeneous dataset. It will empower the development and rigorous assessment of novel methodologies for single-cell analysis.
27 Jul 2024
In the complex landscape of hematologic samples such as peripheral blood or
bone marrow derived from flow cytometry (FC) data, cell-level prediction
presents profound challenges. This work explores injecting hierarchical prior
knowledge into graph neural networks (GNNs) for single-cell multi-class
classification of tabular cellular data. By representing the data as graphs and
encoding hierarchical relationships between classes, we propose our
hierarchical plug-in method to be applied to several GNN models, namely,
FCHC-GNN, and effectively designed to capture neighborhood information crucial
for single-cell FC domain. Extensive experiments on our cohort of 19 distinct
patients, demonstrate that incorporating hierarchical biological constraints
boosts performance significantly across multiple metrics compared to baseline
GNNs without such priors. The proposed approach highlights the importance of
structured inductive biases for gaining improved generalization in complex
biological prediction tasks.
28 Feb 2024
In the realm of hematologic cell populations classification, the intricate
patterns within flow cytometry data necessitate advanced analytical tools. This
paper presents 'HemaGraph', a novel framework based on Graph Attention Networks
(GATs) for single-cell multi-class classification of hematological cells from
flow cytometry data. Harnessing the power of GATs, our method captures subtle
cell relationships, offering highly accurate patient profiling. Based on
evaluation of data from 30 patients, HemaGraph demonstrates classification
performance across five different cell classes, outperforming traditional
methodologies and state-of-the-art methods. Moreover, the uniqueness of this
framework lies in the training and testing phase of HemaGraph, where it has
been applied for extremely large graphs, containing up to hundreds of thousands
of nodes and two million edges, to detect low frequency cell populations (e.g.
0.01% for one population), with accuracies reaching 98%. Our findings
underscore the potential of HemaGraph in improving hematoligic multi-class
classification, paving the way for patient-personalized interventions. To the
best of our knowledge, this is the first effort to use GATs, and Graph Neural
Networks (GNNs) in general, to classify cell populations from single-cell flow
cytometry data. We envision applying this method to single-cell data from
larger cohort of patients and on other hematologic diseases.

25 Mar 2024

The time-consuming task of manual segmentation challenges routine systematic quantification of disease burden. Convolutional neural networks (CNNs) hold significant promise to reliably identify locations and boundaries of tumors from PET scans. We aimed to leverage the need for annotated data via semi-supervised approaches, with application to PET images of diffuse large B-cell lymphoma (DLBCL) and primary mediastinal large B-cell lymphoma (PMBCL). We analyzed 18F-FDG PET images of 292 patients with PMBCL (n=104) and DLBCL (n=188) (n=232 for training and validation, and n=60 for external testing). We employed FCM and MS losses for training a 3D U-Net with different levels of supervision: i) fully supervised methods with labeled FCM (LFCM) as well as Unified focal and Dice loss functions, ii) unsupervised methods with Robust FCM (RFCM) and Mumford-Shah (MS) loss functions, and iii) Semi-supervised methods based on FCM (RFCM+LFCM), as well as MS loss in combination with supervised Dice loss (MS+Dice). Unified loss function yielded higher Dice score (mean +/- standard deviation (SD)) (0.73 +/- 0.03; 95% CI, 0.67-0.8) compared to Dice loss (p-value<0.01). Semi-supervised (RFCM+alpha*LFCM) with alpha=0.3 showed the best performance, with a Dice score of 0.69 +/- 0.03 (95% CI, 0.45-0.77) outperforming (MS+alpha*Dice) for any supervision level (any alpha) (p<0.01). The best performer among (MS+alpha*Dice) semi-supervised approaches with alpha=0.2 showed a Dice score of 0.60 +/- 0.08 (95% CI, 0.44-0.76) compared to another supervision level in this semi-supervised approach (p<0.01). Semi-supervised learning via FCM loss (RFCM+alpha*LFCM) showed improved performance compared to supervised approaches. Considering the time-consuming nature of expert manual delineations and intra-observer variabilities, semi-supervised approaches have significant potential for automated segmentation workflows.
27 Aug 2025
Deep learning models for medical image analysis often suffer from performance degradation when applied to data from different scanners or protocols, a phenomenon known as domain shift. This study investigates this challenge in the context of sex classification from 3D T1-weighted brain magnetic resonance imaging (MRI) scans using the IXI and OASIS3 datasets. While models achieved high within-domain accuracy (around 0.95) when trained and tested on a single dataset (IXI or OASIS3), we demonstrate a significant performance drop to chance level (about 0.50) when models trained on one dataset are tested on the other, highlighting the presence of a strong domain shift. To address this, we employed the ComBat harmonization technique to align the feature distributions of the two datasets. We evaluated three state-of-the-art 3D deep learning architectures (3D ResNet18, 3D DenseNet, and 3D EfficientNet) across multiple training strategies. Our results show that ComBat harmonization effectively reduces the domain shift, leading to a substantial improvement in cross-domain classification performance. For instance, the cross-domain balanced accuracy of our best model (ResNet18 3D with Attention) improved from approximately 0.50 (chance level) to 0.61 after harmonization. t-SNE visualization of extracted features provides clear qualitative evidence of the reduced domain discrepancy post-harmonization. This work underscores the critical importance of domain adaptation techniques for building robust and generalizable neuroimaging AI models.
09 Oct 2024

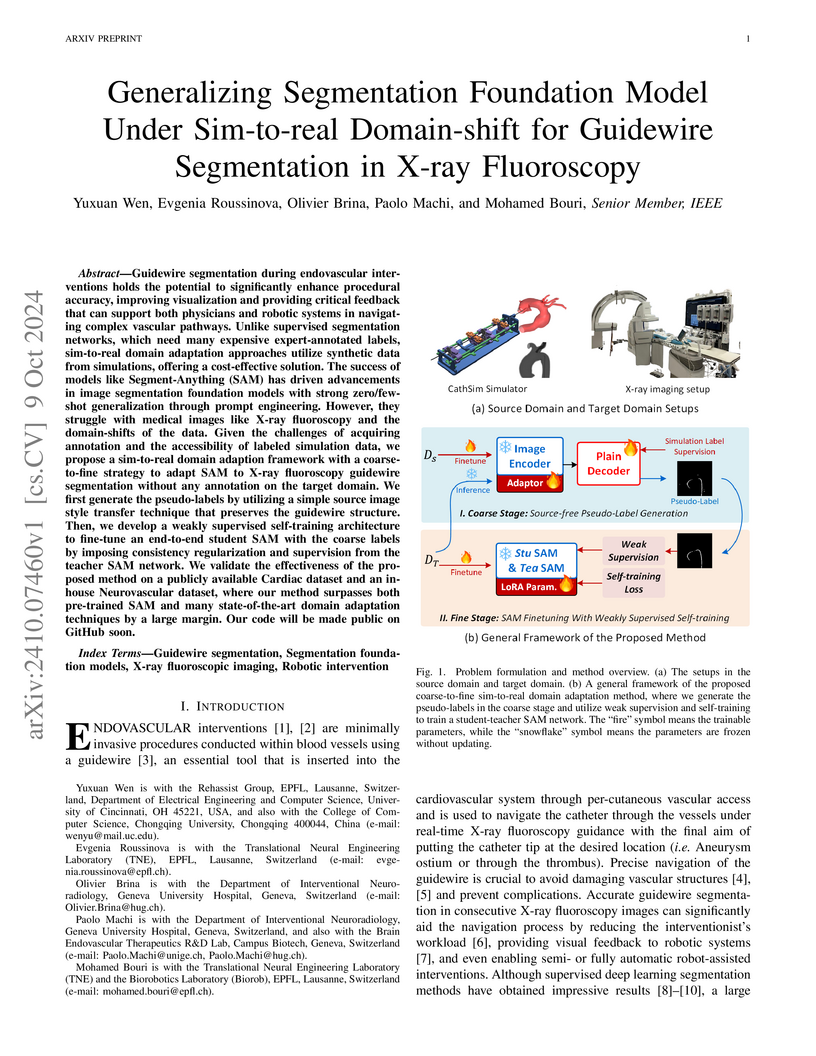
Guidewire segmentation during endovascular interventions holds the potential to significantly enhance procedural accuracy, improving visualization and providing critical feedback that can support both physicians and robotic systems in navigating complex vascular pathways. Unlike supervised segmentation networks, which need many expensive expert-annotated labels, sim-to-real domain adaptation approaches utilize synthetic data from simulations, offering a cost-effective solution. The success of models like Segment-Anything (SAM) has driven advancements in image segmentation foundation models with strong zero/few-shot generalization through prompt engineering. However, they struggle with medical images like X-ray fluoroscopy and the domain-shifts of the data. Given the challenges of acquiring annotation and the accessibility of labeled simulation data, we propose a sim-to-real domain adaption framework with a coarse-to-fine strategy to adapt SAM to X-ray fluoroscopy guidewire segmentation without any annotation on the target domain. We first generate the pseudo-labels by utilizing a simple source image style transfer technique that preserves the guidewire structure. Then, we develop a weakly supervised self-training architecture to fine-tune an end-to-end student SAM with the coarse labels by imposing consistency regularization and supervision from the teacher SAM network. We validate the effectiveness of the proposed method on a publicly available Cardiac dataset and an in-house Neurovascular dataset, where our method surpasses both pre-trained SAM and many state-of-the-art domain adaptation techniques by a large margin. Our code will be made public on GitHub soon.
07 Mar 2022
Brain tumor segmentation is highly contributive in diagnosing and treatment planning. The manual brain tumor delineation is a time-consuming and tedious task and varies depending on the radiologists skill. Automated brain tumor segmentation is of high importance, and does not depend on either inter or intra-observation. The objective of this study is to automate the delineation of brain tumors from the FLAIR, T1 weighted, T2 weighted, and T1 weighted contrast-enhanced MR sequences through a deep learning approach, with a focus on determining which MR sequence alone or which combination thereof would lead to the highest accuracy therein.
28 Feb 2024
In the complex landscape of hematologic samples such as peripheral blood or
bone marrow, cell classification, delineating diverse populations into a
hierarchical structure, presents profound challenges. This study presents
LeukoGraph, a recently developed framework designed explicitly for this purpose
employing graph attention networks (GATs) to navigate hierarchical
classification (HC) complexities. Notably, LeukoGraph stands as a pioneering
effort, marking the application of graph neural networks (GNNs) for
hierarchical inference on graphs, accommodating up to one million nodes and
millions of edges, all derived from flow cytometry data. LeukoGraph intricately
addresses a classification paradigm where for example four different cell
populations undergo flat categorization, while a fifth diverges into two
distinct child branches, exemplifying the nuanced hierarchical structure
inherent in complex datasets. The technique is more general than this example.
A hallmark achievement of LeukoGraph is its F-score of 98%, significantly
outclassing prevailing state-of-the-art methodologies. Crucially, LeukoGraph's
prowess extends beyond theoretical innovation, showcasing remarkable precision
in predicting both flat and hierarchical cell types across flow cytometry
datasets from 30 distinct patients. This precision is further underscored by
LeukoGraph's ability to maintain a correct label ratio, despite the inherent
challenges posed by hierarchical classifications.
22 Mar 2021
Clinical SPECT-MPI images of 345 patients acquired from a dedicated cardiac
SPECT in list-mode format were retrospectively employed to predict normal-dose
images from low-dose data at the half, quarter, and one-eighth-dose levels. A
generative adversarial network was implemented to predict non-gated normal-dose
images in the projection space at the different reduced dose levels.
Established metrics including the peak signal-to-noise ratio (PSNR), root mean
squared error (RMSE), and structural similarity index metrics (SSIM) in
addition to Pearson correlation coefficient analysis and derived parameters
from Cedars-Sinai software were used to quantitatively assess the quality of
the predicted normal-dose images. For clinical evaluation, the quality of the
predicted normal-dose images was evaluated by a nuclear medicine specialist
using a seven-point (-3 to +3) grading scheme. By considering PSNR, SSIM, and
RMSE quantitative parameters among the different reduced dose levels, the
highest PSNR (42.49) and SSIM (0.99), and the lowest RMSE (1.99) were obtained
at the half-dose level in the reconstructed images. Pearson correlation
coefficients were measured 0.997, 0.994, and 0.987 for the predicted
normal-dose images at the half, quarter, and one-eighth-dose levels,
respectively. Regarding the normal-dose images as the reference, the
Bland-Altman plots sketched for the Cedars-Sinai selected parameters exhibited
remarkably less bias and variance in the predicted normal-dose images compared
with the low-dose data at the entire reduced dose levels. Overall, considering
the clinical assessment performed by a nuclear medicine specialist, 100%, 80%,
and 11% of the predicted normal-dose images were clinically acceptable at the
half, quarter, and one-eighth-dose levels, respectively.

06 Jul 2022
A standard dose of radioactive tracer must be delivered into the patients body to obtain high-quality Positron Emission Tomography (PET) images for diagnostic purposes, which raises the risk of radiation harm. A reduced tracer dose, on the other hand, results in poor image quality and a noise-induced quantitative bias in PET imaging. The partial volume effect (PVE), which is the result of PET intrinsic limited spatial resolution, is another source of quality and quantity degradation in PET imaging. The utilization of anatomical information for PVE correction (PVC) is not straightforward due to the internal organ motions, patient involuntary motions, and discrepancies in the appearance and size of the structures in anatomical and functional images. Furthermore, an additional MR imaging session is necessary for anatomical information, which may not be available. We set out to build a deep learning-based framework for predicting partial volume corrected full-dose (FD-PVC) pictures from either standard or low-dose (LD) PET images without requiring any anatomical data in order to provide a joint solution for PVC and denoise low-dose PET images.
16 Feb 2021
We set out to simulate four reduced dose-levels (60%-dose, 40%-dose,
20%-dose, and 10%-dose) of standard CT imaging using Beer-Lambert's law across
49 patients infected with COVID-19. Then, three denoising filters, namely
Gaussian, Bilateral, and Median, were applied to the different low-dose CT
images, the quality of which was assessed prior to and after the application of
the various filters via calculation of peak signal-to-noise ratio (PSNR), root
mean square error (RMSE), structural similarity index measure (SSIM), and
relative CT-value bias, separately for the lung tissue and whole-body. The
quantitative evaluation indicated that 10%-dose CT images have inferior quality
(with RMSE=322.1-+104.0 HU and bias=11.44-+4.49% in the lung) even after the
application of the denoising filters. The bilateral filter exhibited superior
performance to suppress the noise and recover the underlying signals in
low-dose CT images compared to the other denoising techniques. The bilateral
filter led to RMSE and bias of 100.21-+16.47 HU, -0.21-+1.20%, respectively in
the lung regions for 20%-dose CT images compared to the Gaussian filter with
RMSE=103.46-+15.70 HU and bias=1.02-+1.68%, median filter with
RMSE=129.60-+18.09 HU and bias=-6.15-+2.24%, and the nonfiltered 20%-dose CT
with RMSE=217.37-+64.66 HU and bias=4.30-+1.85%. In conclusion, the 20%-dose CT
imaging followed by the bilateral filtering introduced a reasonable compromise
between image quality and patient dose reduction.
20 May 2021
The presence of metal implants within CT imaging causes severe attenuation of
the X-ray beam. Due to the incomplete information recorded by CT detectors,
artifacts in the form of streaks and dark bands would appear in the resulting
CT images. The metal-induced artifacts would firstly affect the quantitative
accuracy of CT imaging, and consequently, the radiation treatment planning and
dose estimation in radiation therapy. To address this issue, CT scanner vendors
have implemented metal artifact reduction (MAR) algorithms to avoid such
artifacts and enhance the overall quality of CT images. The orthopedic-MAR
(OMAR) and normalized MAR (NMAR) algorithms are the most well-known metal
artifact reduction (MAR) algorithms, used worldwide. These algorithms have been
implemented on Philips and Siemens scanners, respectively. In this study, we
set out to quantitatively and qualitatively evaluate the effectiveness of these
two MAR algorithms and their impact on accurate radiation treatment planning
and CT-based dosimetry. The quantitative metrics measured on the simulated
metal artifact dataset demonstrated superior performance of the OMAR technique
over the NMAR one in metal artifact reduction. The analysis of radiation
treatment planning using the OMAR and NMAR techniques in the corrected CT
images showed that the OMAR technique reduced the toxicity of healthy tissues
by 10% compared to the uncorrected CT images.
10 Feb 2021
Objective: In this work, we set out to investigate the accuracy of direct
attenuation correction (AC) in the image domain for the myocardial perfusion
SPECT imaging (MPI-SPECT) using two residual (ResNet) and UNet deep
convolutional neural networks. Methods: The MPI-SPECT 99mTc-sestamibi images of
99 participants were retrospectively examined. UNet and ResNet networks were
trained using SPECT non-attenuation corrected images as input and CT-based
attenuation corrected SPECT images (CT-AC) as reference. The Chang AC approach,
considering a uniform attenuation coefficient within the body contour, was also
implemented. Quantitative and clinical evaluation of the proposed methods were
performed considering SPECT CT-AC images of 19 subjects as reference using the
mean absolute error (MAE), structural similarity index (SSIM) metrics, as well
as relevant clinical indices such as perfusion deficit (TPD). Results: Overall,
the deep learning solution exhibited good agreement with the CT-based AC,
noticeably outperforming the Chang method. The ResNet and UNet models resulted
in the ME (count) of and and SSIM of
and , respectively. While the Change approach
led to ME and SSIM of and , respectively.
Similarly, the clinical evaluation revealed a mean TPD of and
for the ResNet and UNet models, respectively, compared to
obtained from the reference SPECT CT-AC images. On the other
hand, the Chang approach led to a mean TPD of . Conclusion: We
evaluated two deep convolutional neural networks to estimate SPECT-AC images
directly from the non-attenuation corrected images. The deep learning solutions
exhibited the promising potential to generate reliable attenuation corrected
SPECT images without the use of transmission scanning.
24 Oct 2022
Radiomics features extract quantitative information from medical images,
towards the derivation of biomarkers for clinical tasks, such as diagnosis,
prognosis, or treatment response assessment. Different image discretization
parameters (e.g. bin number or size), convolutional filters, segmentation
perturbation, or multi-modality fusion levels can be used to generate radiomics
features and ultimately signatures. Commonly, only one set of parameters is
used; resulting in only one value or flavour for a given RF. We propose tensor
radiomics (TR) where tensors of features calculated with multiple combinations
of parameters (i.e. flavours) are utilized to optimize the construction of
radiomics signatures. We present examples of TR as applied to PET/CT, MRI, and
CT imaging invoking machine learning or deep learning solutions, and
reproducibility analyses: (1) TR via varying bin sizes on CT images of lung
cancer and PET-CT images of head & neck cancer (HNC) for overall survival
prediction. A hybrid deep neural network, referred to as TR-Net, along with two
ML-based flavour fusion methods showed improved accuracy compared to regular
rediomics features. (2) TR built from different segmentation perturbations and
different bin sizes for classification of late-stage lung cancer response to
first-line immunotherapy using CT images. TR improved predicted patient
responses. (3) TR via multi-flavour generated radiomics features in MR imaging
showed improved reproducibility when compared to many single-flavour features.
(4) TR via multiple PET/CT fusions in HNC. Flavours were built from different
fusions using methods, such as Laplacian pyramids and wavelet transforms. TR
improved overall survival prediction. Our results suggest that the proposed TR
paradigm has the potential to improve performance capabilities in different
medical imaging tasks.
19 Dec 2022
In the first step, a pre-trained model (YOLO) was used to detect all suspicious nod-ules. The YOLO model was re-trained using 397 CT images to detect the entire nodule in CT images. To maximize the sensitivity of the model, a confidence level (the probability threshold for object detection) of 0.3 was set for nodule detection in the first phase (ensuring the entire suspicious nodules are detected from the input CT images). The aim of the hierarchy model is to detect and classify the entire lung nodules (from CT images) with a low false-negative rate. Given the outcome of the first step, we proposed a 3D CNN classifier to analyze and classify the suspicious nodules detected by the YOLO model to achieve a nodule detection framework with a very low false-negative rate. This framework was evaluated using the LUNA 16 dataset, which consists of 888 CT images containing the location of 1186 nodules and 400000 non-nodules in the lung. Results: A large number of false positives were detected due to the low confidence level used in the YOLO model. Utilizing the 3D classifier, the accuracy of nodule detection was remarkably enhanced. The YOLO model detected 294 suspicious nodules (out of 321) when using a confidence level of 50%, wherein there were 107 false positives (187 true positives). By reducing the confidence level to 30%, 459 suspicious nodules were identified by the YOLO model, wherein 138 were false positives, and 321 were true positives. When the outcome of the YOLO model with a confidence level of 30% was fed into the 3D CNN classifier, a nodule detection accuracy of 98.4% and AUC of 98.9% were achieved Conclusion: The proposed framework resulted in a few false-negative and false-positives pre-dictions in nodule detection from CT images. The proposed approach would be helpful in detecting pulmonary nodules from CT images as a decision support tool.
There are no more papers matching your filters at the moment.
