03 Sep 2017
3D reconstruction is a technique used in computer vision which has a wide
range of applications in areas like object recognition, city modelling, virtual
reality, physical simulations, video games and special effects. Previously, to
perform a 3D reconstruction, specialized hardwares were required. Such systems
were often very expensive and was only available for industrial or research
purpose. With the rise of the availability of high-quality low cost 3D sensors,
it is now possible to design inexpensive complete 3D scanning systems. The
objective of this work was to design an acquisition and processing system that
can perform 3D scanning and reconstruction of objects seamlessly. In addition,
the goal of this work also included making the 3D scanning process fully
automated by building and integrating a turntable alongside the software. This
means the user can perform a full 3D scan only by a press of a few buttons from
our dedicated graphical user interface. Three main steps were followed to go
from acquisition of point clouds to the finished reconstructed 3D model. First,
our system acquires point cloud data of a person/object using inexpensive
camera sensor. Second, align and convert the acquired point cloud data into a
watertight mesh of good quality. Third, export the reconstructed model to a 3D
printer to obtain a proper 3D print of the model.
04 Jan 2025
This study explores the link between the capital share and income inequality over the past four decades across 56 countries. Calculating the capital share from national accounts alongside top income share data from the World Inequality Database, which is based on the Distributional National Accounts methodology, we ensure the consistency in the theory and measurement. Employing a structural econometric approach, we account for heterogeneous and time-varying transmission coefficients from the capital share to personal income inequality. Our findings reveal that a one percentage point (pp) increase in the capital share raises the income share of the top 5% by 0.17 pp on average. Advanced economies show a stable transmission coefficient with rising capital and labor income inequality, while emerging economies experience an increasing transmission coefficient alongside growing capital income inequality. In contrast, a third group exhibits a declining transmission coefficient and rising labor income inequality. Overall, changes in the capital share account for approximately 50% of the rise in income inequality, underscoring its pivotal role over the last four decades.
28 Oct 2019
Due to the recent demand of 3-D models in several applications like medical imaging, video games, among others, the necessity of implementing 3-D mesh watermarking schemes aiming to protect copyright has increased considerably. The majority of robust 3-D watermarking techniques have essentially focused on the robustness against attacks while the imperceptibility of these techniques is still a real issue. In this context, a blind robust 3-D mesh watermarking method based on mesh saliency and Quantization Index Modulation (QIM) for Copyright protection is proposed. The watermark is embedded by quantifying the vertex norms of the 3-D mesh using QIM scheme since it offers a good robustness-capacity tradeoff. The choice of the vertices is adjusted by the mesh saliency to achieve watermark robustness and to avoid visual distortions. The experimental results show the high imperceptibility of the proposed scheme while ensuring a good robustness against a wide range of attacks including additive noise, similarity transformations, smoothing, quantization, etc.
30 Oct 2020
In this paper, we propose a new deep learning framework for an automatic
myocardial infarction evaluation from clinical information and delayed
enhancement-MRI (DE-MRI). The proposed framework addresses two tasks. The first
task is automatic detection of myocardial contours, the infarcted area, the
no-reflow area, and the left ventricular cavity from a short-axis DE-MRI
series. It employs two segmentation neural networks. The first network is used
to segment the anatomical structures such as the myocardium and left
ventricular cavity. The second network is used to segment the pathological
areas such as myocardial infarction, myocardial no-reflow, and normal
myocardial region. The segmented myocardium region from the first network is
further used to refine the second network's pathological segmentation results.
The second task is to automatically classify a given case into normal or
pathological from clinical information with or without DE-MRI. A cascaded
support vector machine (SVM) is employed to classify a given case from its
associated clinical information. The segmented pathological areas from DE-MRI
are also used for the classification task. We evaluated our method on the 2020
EMIDEC MICCAI challenge dataset. It yielded an average Dice index of 0.93 and
0.84, respectively, for the left ventricular cavity and the myocardium. The
classification from using only clinical information yielded 80% accuracy over
five-fold cross-validation. Using the DE-MRI, our method can classify the cases
with 93.3% accuracy. These experimental results reveal that the proposed method
can automatically evaluate the myocardial infarction.
20 Dec 2018
Cluster validity indexes are very important tools designed for two purposes:
comparing the performance of clustering algorithms and determining the number
of clusters that best fits the data. These indexes are in general constructed
by combining a measure of compactness and a measure of separation. A classical
measure of compactness is the variance. As for separation, the distance between
cluster centers is used. However, such a distance does not always reflect the
quality of the partition between clusters and sometimes gives misleading
results. In this paper, we propose a new cluster validity index for which
Jeffrey divergence is used to measure separation between clusters. Experimental
results are conducted using different types of data and comparison with widely
used cluster validity indexes demonstrates the outperformance of the proposed
index.
09 Jul 2019
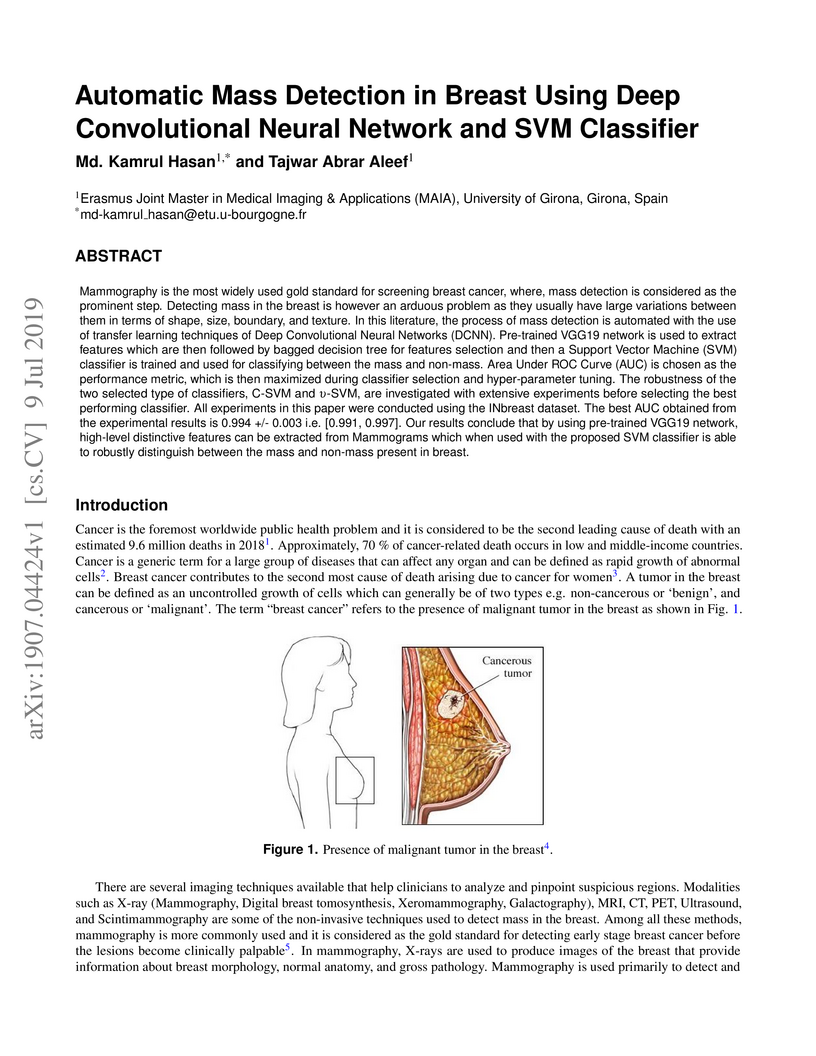
Mammography is the most widely used gold standard for screening breast cancer, where, mass detection is considered as the prominent step. Detecting mass in the breast is, however, an arduous problem as they usually have large variations between them in terms of shape, size, boundary, and texture. In this literature, the process of mass detection is automated with the use of transfer learning techniques of Deep Convolutional Neural Networks (DCNN). Pre-trained VGG19 network is used to extract features which are then followed by bagged decision tree for features selection and then a Support Vector Machine (SVM) classifier is trained and used for classifying between the mass and non-mass. Area Under ROC Curve (AUC) is chosen as the performance metric, which is then maximized during classifier selection and hyper-parameter tuning. The robustness of the two selected type of classifiers, C-SVM, and \u{psion}-SVM, are investigated with extensive experiments before selecting the best performing classifier. All experiments in this paper were conducted using the INbreast dataset. The best AUC obtained from the experimental results is 0.994 +/- 0.003 i.e. [0.991, 0.997]. Our results conclude that by using pre-trained VGG19 network, high-level distinctive features can be extracted from Mammograms which when used with the proposed SVM classifier is able to robustly distinguish between the mass and non-mass present in breast.
02 Nov 2019
In this paper, a robust blind image watermarking method is proposed for
copyright protection of digital images. This hybrid method relies on combining
two well-known transforms that are the discrete Fourier transform (DFT) and the
discrete cosine transform (DCT). The motivation behind this combination is to
enhance the imperceptibility and the robustness. The imperceptibility
requirement is achieved by using magnitudes of DFT coefficients while the
robustness improvement is ensured by applying DCT to the DFT coefficients
magnitude. The watermark is embedded by modifying the coefficients of the
middle band of the DCT using a secret key. The security of the proposed method
is enhanced by applying Arnold transform (AT) to the watermark before
embedding. Experiments were conducted on natural and textured images. Results
show that, compared with state-of-the-art methods, the proposed method is
robust to a wide range of attacks while preserving high imperceptibility.
04 Mar 2025

Objective: ascending aortic aneurysm growth prediction is still challenging
in clinics. In this study, we evaluate and compare the ability of local and
global shape features to predict ascending aortic aneurysm growth.
Material and methods: 70 patients with aneurysm, for which two 3D
acquisitions were available, are included. Following segmentation, three local
shape features are computed: (1) the ratio between maximum diameter and length
of the ascending aorta centerline, (2) the ratio between the length of external
and internal lines on the ascending aorta and (3) the tortuosity of the
ascending tract. By exploiting longitudinal data, the aneurysm growth rate is
derived. Using radial basis function mesh morphing, iso-topological surface
meshes are created. Statistical shape analysis is performed through
unsupervised principal component analysis (PCA) and supervised partial least
squares (PLS). Two types of global shape features are identified: three
PCA-derived and three PLS-based shape modes. Three regression models are set
for growth prediction: two based on gaussian support vector machine using local
and PCA-derived global shape features; the third is a PLS linear regression
model based on the related global shape features. The prediction results are
assessed and the aortic shapes most prone to growth are identified.
Results: the prediction root mean square error from leave-one-out
cross-validation is: 0.112 mm/month, 0.083 mm/month and 0.066 mm/month for
local, PCA-based and PLS-derived shape features, respectively. Aneurysms close
to the root with a large initial diameter report faster growth.
Conclusion: global shape features might provide an important contribution for
predicting the aneurysm growth.
16 Jul 2012
The selection of the best classification algorithm for a given dataset is a very widespread problem. It is also a complex one, in the sense it requires to make several important methodological choices. Among them, in this work we focus on the measure used to assess the classification performance and rank the algorithms. We present the most popular measures and discuss their properties. Despite the numerous measures proposed over the years, many of them turn out to be equivalent in this specific case, to have interpretation problems, or to be unsuitable for our purpose. Consequently, classic overall success rate or marginal rates should be preferred for this specific task.
26 Nov 2017
Community structure is of paramount importance for the understanding of
complex networks. Consequently, there is a tremendous effort in order to
develop efficient community detection algorithms. Unfortunately, the issue of a
fair assessment of these algorithms is a thriving open question. If the
ground-truth community structure is available, various clustering-based metrics
are used in order to compare it versus the one discovered by these algorithms.
However, these metrics defined at the node level are fairly insensitive to the
variation of the overall community structure. To overcome these limitations, we
propose to exploit the topological features of the 'community graphs' (where
the nodes are the communities and the links represent their interactions) in
order to evaluate the algorithms. To illustrate our methodology, we conduct a
comprehensive analysis of overlapping community detection algorithms using a
set of real-world networks with known a priori community structure. Results
provide a better perception of their relative performance as compared to
classical metrics. Moreover, they show that more emphasis should be put on the
topology of the community structure. We also investigate the relationship
between the topological properties of the community structure and the
alternative evaluation measures (quality metrics and clustering metrics). It
appears clearly that they present different views of the community structure
and that they must be combined in order to evaluate the effectiveness of
community detection algorithms.
20 Jan 2025
This paper presents a new mesh segmentation method that integrates
geometrical and topological features through a flexible Reeb graph
representation. The algorithm consists of three phases: construction of the
Reeb graph using the improved topological skeleton approach, topological
simplification of the graph by cancelling critical points while preserving
essential features, and generation of contiguous segments via an adaptive
region-growth process that takes geometric and topological criteria into
account. Operating with a computational complexity of O(n log(n)) for a mesh of
n vertices, the method demonstrates both efficiency and scalability. An
evaluation through case studies, including part-based decomposition with Shape
Diameter Function and terrain analysis with Shape Index, validates the
effectiveness of the method in completely different applications. The results
establish this approach as a robust framework for advanced geometric analysis
of meshes, connecting the geometric and topological features of shapes.
08 Nov 2024

Automatic brain tissue segmentation from Magnetic Resonance Imaging (MRI) images is vital for accurate diagnosis and further analysis in medical imaging. Despite advancements in segmentation techniques, a comprehensive comparison between traditional statistical methods and modern deep learning approaches using pre-processing techniques like N4 Bias Field Correction and Anisotropic Diffusion remains underexplored. This study provides a comparative analysis of various segmentation models, including Probabilistic ATLAS, U-Net, nnU-Net, and LinkNet, enhanced with these pre-processing techniques to segment brain tissues (white matter (WM), grey matter (GM) and cerebrospinal fluid (CSF)) on the Internet Brain Segmentation Repository (IBSR18) dataset. Our results demonstrate that the 3D nnU-Net model outperforms others, achieving the highest mean Dice Coefficient score (0.937 +- 0.012), while the 2D nnU-Net model recorded the lowest mean Hausdorff Distance (5.005 +- 0.343 mm) and the lowest mean Absolute Volumetric Difference (3.695 +- 2.931 mm) across five unseen test samples. The findings highlight the superiority of nnU-Net models in brain tissue segmentation, particularly when combined with N4 Bias Field Correction and Anisotropic Diffusion pre-processing techniques. Our implemented code can be accessed via GitHub.
21 Nov 2023
Are similar, or even identical, mechanisms used in the computational modeling of speech segmentation, serial image processing and music processing? We address this question by exploring how TRACX2, (French et al., 2011; French \& Cottrell, 2014; Mareschal \& French, 2017), a recognition-based, recursive connectionist autoencoder model of chunking and sequence segmentation, which has successfully simulated speech and serial-image processing, might be applied to elementary melody perception. The model, a three-layer autoencoder that recognizes ''chunks'' of short sequences of intervals that have been frequently encountered on input, is trained on the tone intervals of melodically simple French children's songs. It dynamically incorporates the internal representations of these chunks into new input. Its internal representations cluster in a manner that is consistent with ''human-recognizable'' melodic categories. TRACX2 is sensitive to both contour and proximity information in the musical chunks that it encounters in its input. It shows the ''end-of-word'' superiority effect demonstrated by Saffran et al. (1999) for short musical phrases. The overall findings suggest that the recursive autoassociative chunking mechanism, as implemented in TRACX2, may be a general segmentation and chunking mechanism, underlying not only word-and imagechunking, but also elementary melody processing.
27 Nov 2014
Although color is a fundamental feature of human visual perception, it has been largely unexplored in the reduced-reference (RR) image quality assessment (IQA) schemes. In this paper, we propose a natural scene statistic (NSS) method, which efficiently uses this information. It is based on the statistical deviation between the steerable pyramid coefficients of the reference color image and the degraded one. We propose and analyze the multivariate generalized Gaussian distribution (MGGD) to model the underlying statistics. In order to quantify the degradation, we develop and evaluate two measures based respectively on the Geodesic distance between two MGGDs and on the closed-form of the Kullback Leibler divergence. We performed an extensive evaluation of both metrics in various color spaces (RGB, HSV, CIELAB and YCrCb) using the TID 2008 benchmark and the FRTV Phase I validation process. Experimental results demonstrate the effectiveness of the proposed framework to achieve a good consistency with human visual perception. Furthermore, the best configuration is obtained with CIELAB color space associated to KLD deviation measure.
08 Dec 2014
This paper deals with a reduced reference (RR) image quality measure based on natural image statistics modeling. For this purpose, Tetrolet transform is used since it provides a convenient way to capture local geometric structures. This transform is applied to both reference and distorted images. Then, Gaussian Scale Mixture (GSM) is proposed to model subbands in order to take account statistical dependencies between tetrolet coefficients. In order to quantify the visual degradation, a measure based on Kullback Leibler Divergence (KLD) is provided. The proposed measure was tested on the Cornell VCL A-57 dataset and compared with other measures according to FR-TV1 VQEG framework.
29 Jul 2024
As networks grow in size and complexity, backbones become an essential network representation. Indeed, they provide a simplified yet informative overview of the underlying organization by retaining the most significant and structurally influential connections within a network. Network heterogeneity often results in complex and intricate structures, making it challenging to identify the backbone. In response, we introduce the Multilevel Backbone Extraction Framework, a novel approach that diverges from conventional backbone methodologies. This generic approach prioritizes the mesoscopic organization of networks. First, it splits the network into homogeneous-density components. Second, it extracts independent backbones for each component using any classical Backbone technique. Finally, the various backbones are combined. This strategy effectively addresses the heterogeneity observed in network groupings. Empirical investigations on real-world networks underscore the efficacy of the Multilevel Backbone approach in preserving essential network structures and properties. Experiments demonstrate its superiority over classical methods in handling network heterogeneity and enhancing network integrity. The framework is adaptable to various types of networks and backbone extraction techniques, making it a versatile tool for network analysis and backbone extraction across diverse network applications.
04 Sep 2023
Recent advances in 3D X-ray Computed Tomographic (CT) sensors have stimulated research efforts to unveil the extremely complex micro-scale processes that control the activity of soil microorganisms. Voxel-based description (up to hundreds millions voxels) of the pore space can be extracted, from grey level 3D CT scanner images, by means of simple image processing tools. Classical methods for numerical simulation of biological dynamics using mesh of voxels, such as Lattice Boltzmann Model (LBM), are too much time consuming. Thus, the use of more compact and reliable geometrical representations of pore space can drastically decrease the computational cost of the simulations. Several recent works propose basic analytic volume primitives (e.g. spheres, generalized cylinders, ellipsoids) to define a piece-wise approximation of pore space for numerical simulation of draining, diffusion and microbial decomposition. Such approaches work well but the drawback is that it generates approximation errors. In the present work, we study another alternative where pore space is described by means of geometrically relevant connected subsets of voxels (regions) computed from the curvilinear skeleton. Indeed, many works use the curvilinear skeleton (3D medial axis) for analyzing and partitioning 3D shapes within various domains (medicine, material sciences, petroleum engineering, etc.) but only a few ones in soil sciences. Within the context of soil sciences, most studies dealing with 3D medial axis focus on the determination of pore throats. Here, we segment pore space using curvilinear skeleton in order to achieve numerical simulation of microbial decomposition (including diffusion processes). We validate simulation outputs by comparison with other methods using different pore space geometrical representations (balls, voxels).
13 Dec 2018

Network models have been increasingly used in the past years to support summarization and analysis of narratives, such as famous TV series, books and news. Inspired by social network analysis, most of these models focus on the characters at play. The network model well captures all characters interactions, giving a broad picture of the narration's content. A few works went beyond by introducing additional semantic elements, always captured in a single layer network. In contrast, we introduce in this work a multilayer network model to capture more elements of the narration of a movie from its script: people, locations, and other semantic elements. This model enables new measures and insights on movies. We demonstrate this model on two very popular movies.
07 May 2011
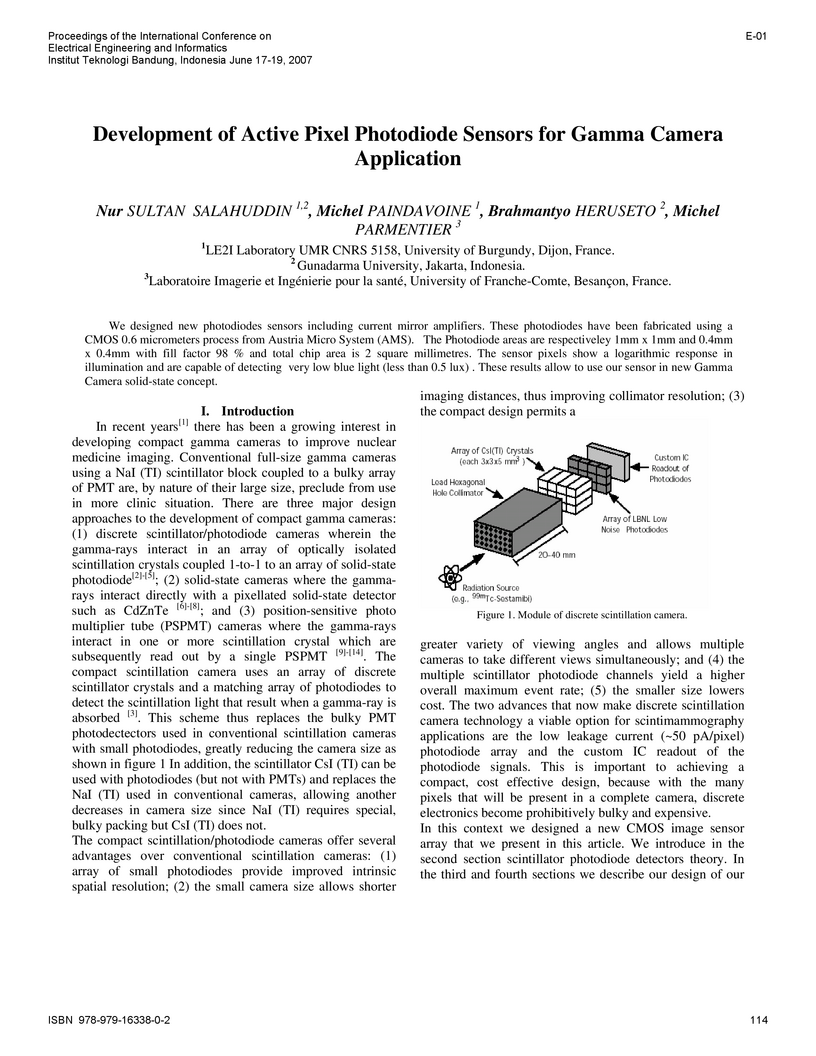
We designed new photodiodes sensors including current mirror amplifiers. These photodiodes have been fabricated using a CMOS 0.6 micrometers process from Austria Micro System (AMS). The Photodiode areas are respectiveley 1mm x 1mm and 0.4mm x 0.4mm with fill factor 98 % and total chip area is 2 square millimetres. The sensor pixels show a logarithmic response in illumination and are capable of detecting very low blue light (less than 0.5 lux) . These results allow to use our sensor in new Gamma Camera solid-state concept.
21 Jun 2012
Community detection is one of the most active fields in complex networks analysis, due to its potential value in practical applications. Many works inspired by different paradigms are devoted to the development of algorithmic solutions allowing to reveal the network structure in such cohesive subgroups. Comparative studies reported in the literature usually rely on a performance measure considering the community structure as a partition (Rand Index, Normalized Mutual information, etc.). However, this type of comparison neglects the topological properties of the communities. In this article, we present a comprehensive comparative study of a representative set of community detection methods, in which we adopt both types of evaluation. Community-oriented topological measures are used to qualify the communities and evaluate their deviation from the reference structure. In order to mimic real-world systems, we use artificially generated realistic networks. It turns out there is no equivalence between both approaches: a high performance does not necessarily correspond to correct topological properties, and vice-versa. They can therefore be considered as complementary, and we recommend applying both of them in order to perform a complete and accurate assessment.
There are no more papers matching your filters at the moment.
